Numbers, Analytics, and The Fun Things You Can Do With Them
Numbers are fun. Quantification is the quintessential human method of progress, whether it’s the number of Facebook friends, stars on Yelp, revenue this quarter, stock prices, or touchdowns scored. Even better, we’re surrounded by databases of numbers describing everything around us. As a person with analytical tendencies, I get excited about doing this with these numbers, and as a computer science major, I want to automate that process. At the past hackathons I’ve been to, when I wasn’t working on my official project, I figured I’d try to interpret some of these numbers.
The first weekend of February was the Tufts Hackathon, which I co-organized with my friend Will. As a result, I spent most of the event moving chairs, feeding people, passing out swag, and tweeting. Now, I’ve always noticed a casual correlation between my attendance at hackathons and the frequency of tweets that I send out. Sitting on a computer all night can inspire you to broadcast more of your 140-character thoughts. I figured I’d formalize this theory with a graph:
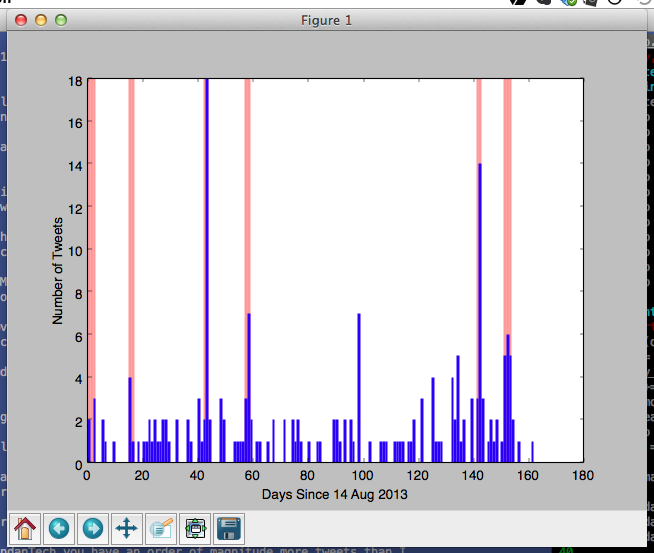
Purple bars are my tweets. Pink bars are days I was at hackathons. Suspicions confirmed.
In fact, the numbers don’t lie: my average tweets per day is 1.234; my average tweets per day during hackathons is 8.333. Here’s the bit of Python code that I used to calculate ‘em.

You can see from the line numbers that this is a snippet from the middle of my code. For background, I’ve got days, a list of tweets per day (which I got using the Twitter API), and hackathons, a list of dates I was at hackathons. I get the average of tweets overall by summing up the total number of tweets and dividing by the number of days, and the average hackathon tweets by adding up tweets per day for each day I was at a hackathon, and dividing by the number of days I was at hackathons.
Bam.
Then, at PennApps, I was playing around with the Rotten Tomatoes API and animals, and I determined the following conclusions:
-
Movies about cats and movies about dogs are equally well liked (average audience score of 62%)
-
Movies about cats that mention dogs do 23% worse than those that don’t mention dogs.
-
Movies about dogs that mention cats do ony 16% worse than their counterparts that don’t mention dogs.
-
Chicken movies do nearly twice as well when they mention in the description that they are about chickens.
If you think this is ridiculous / made up, check out the code. I included instructions on how to run it yourself, so try it out and see what you think!
Do you think my claims are totally false? Am I misinterpreting the data? Want to hear about the super sketchy things I did in the Twitter project that made me too embarrassed to put the whole codebase online (Hint: look at the units of the x-axis)? Leave a comment or tweet at me!